Full 2025 season
−0.150EPA / dropback · 287 plays72.6 rating · 11 TD / 12 INTTHE POST-DEADLINE RECEIPTS · NOVEMBER 12, 2026
A FIFTH
FOR NINE.
A THIRD
FOR KIRK.
Minnesota traded JJ McCarthy for a fifth-round pick. Forty-three days later, it spent a third to bring Kirk Cousins back. Let’s look at what the quarterback plan delivered.
Games through Nov. 9 · Two separate trades · The fifth-round pick is still a future asset.
THE LATEST TURN
Kirk is back.
The Kyler plan has changed.
Minnesota acquired Cousins to play. Murray is expected to back him up when healthy; he remains week-to-week with a hamstring injury. In the Nov. 11 update, O’Connell had not fully confirmed Sunday’s starter and hoped Wentz could be available as No. 2. Read the team’s update ↗
Status reporting checked Nov. 12. Intended roles and game-day availability are different questions.
01 / THE NUMBERS
Same question.
Actual production.
Start with this season. Then isolate the late Vikings run—or put the two stretches together. Every view keeps its dates and counts attached.
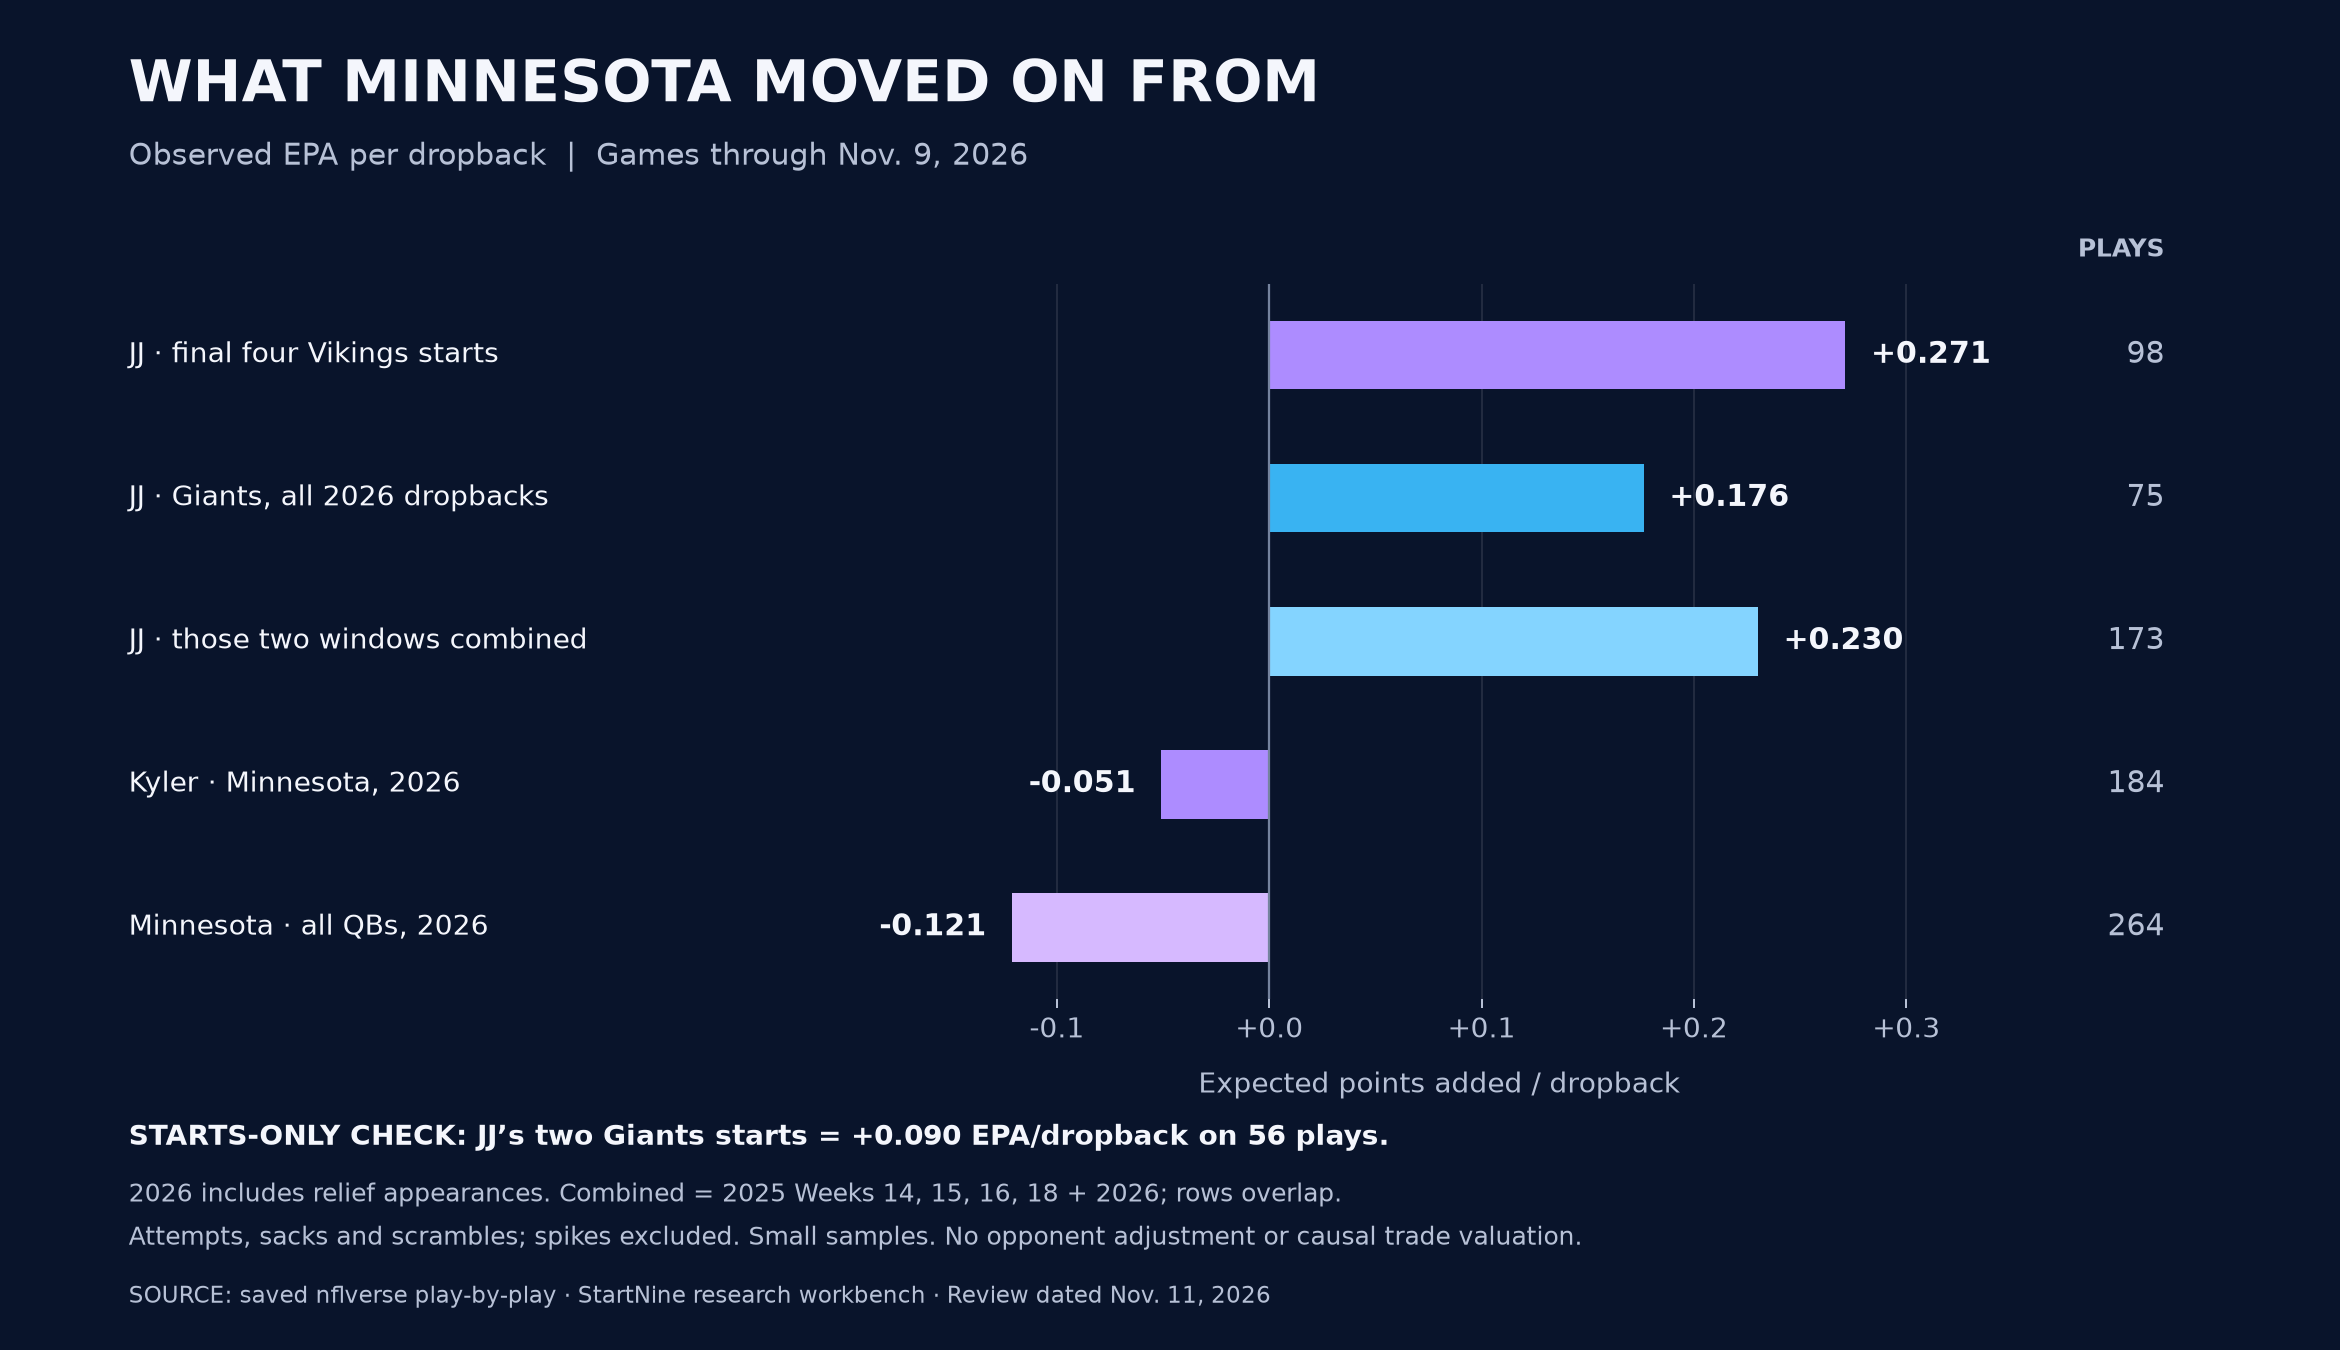
Giants 2026 · all appearances
75 analytical dropbacksFour appearances; three games with counted dropbacks; two starts. Includes the New Orleans relief appearance.
Swipe the table to compare every quarterback →
| Measure | JJ · Giants 2026 | Kyler · MIN 2026 | All MIN QBs · 2026 |
|---|---|---|---|
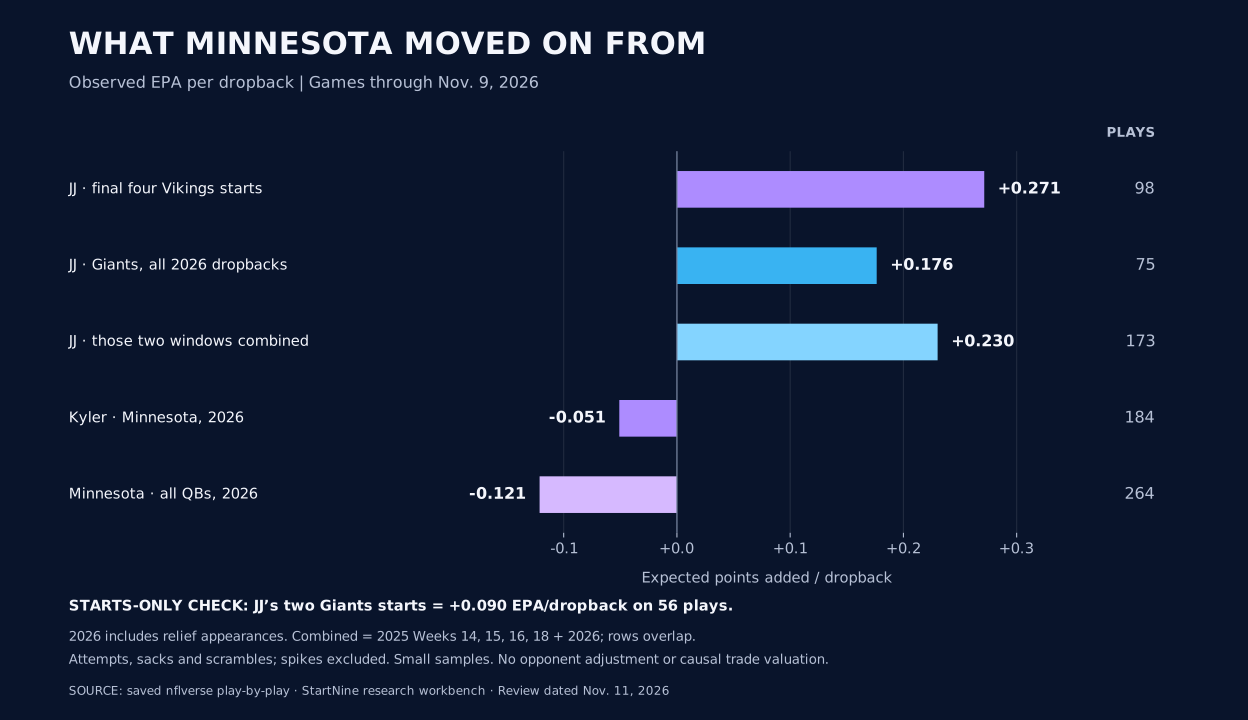
| EPA / dropback | +0.176 | −0.051 | −0.121 |
| Analytical dropbacks | 75 | 184 | 264 |
| Completions / attempts | 43 / 68 | 100 / 154 | 137 / 225 |
| Passing yards | 622 | 1,022 | 1,437 |
| Passing TD / INT | 1 / 1 | 5 / 3 | 8 / 5 |
| Box-score passer rating | 91.7 | 86.6 | 82.0 |
| CPOE · percentage points | +5.3 | +2.0 | −2.9 |
| Positive-EPA play rate | 38.7% | 39.7% | 37.9% |
| Sacks / analytical dropbacks | 12.0% | 8.2% | 8.7% |
Minnesota columns always show 2026 Weeks 1–9. Different workloads, opponents and offenses; this does not tell us how JJ would have played had he stayed.
Source: nflverse play-by-play. Attempts and passer ratings include spikes; EPA, CPOE and analytical dropbacks exclude spikes. See the exact definitions.
THE BACKUP PLAN COUNTS, TOO
Carson Wentz: −0.291 EPA/dropback on 72 plays. The whole Minnesota room: −0.121 on 264. Since the JJ trade, Minnesota’s quarterbacks have produced −0.131 on 176. This was a quarterback-room decision, not just a Kyler comparison.
02 / BEFORE NEW YORK
The improvement
was already there.
The full 2025 season was rough. The closing stretch was different. Show both—and let the reader see the change.
Final four 2025 starts
+0.271EPA / dropback · 98 plays100.4 rating · 5 TD / 2 INTGiants 2026
+0.176EPA / dropback · 75 plays91.7 rating · 1 TD / 1 INTvs. Washington
+0.401 EPA / DB163 yards · 3 TD · 0 INT
29 analytical dropbacks
at Dallas
+0.526 EPA / DB250 yards · 2 TD · 1 INT
26 analytical dropbacks
at New York
−0.238 EPA / DB108 yards · 0 TD · 1 INT
19 analytical dropbacks
vs. Green Bay
+0.242 EPA / DB182 yards · 0 TD · 0 INT
24 analytical dropbacks
2025-season Weeks 14, 15, 16 and 18—not four consecutive weeks or four complete games. Full-season and late-season rows overlap. The combined view includes this same late segment again. Inspect the games in Research.
03 / A SECOND LENS
The PFF context.
Including the inconvenient bits.
The grades support JJ’s case. They don’t say he wins every category.
Swipe the table to compare every quarterback →
| Measure | JJ · NYG | Kyler · MIN | Wentz · MIN | Cousins · LV |
|---|---|---|---|---|
| Passing grade | 78.5 | 68.6 | 35.2 | 75.5 |
| Big-time throws | 7 | 5 | 2 | 12 |
| Turnover-worthy plays | 1 | 3 | 6 | 10 |
| Adjusted completion | 75.4% | 76.4% | 56.9% | 73.8% |
| Pressure-to-sack rate | 27.3% | 22.4% | 25.0% | 9.8% |
Source: PFF Passing Summary / Pressure. PFF grades are not EPA. Its dropback counts and opportunity definitions differ from the public calculations. Cousins’ statistics here are from Las Vegas.
What carries over
JJ’s final four 2025 starts: 72.3 passing grade, eight big-time throws and three turnover-worthy plays. Across those games and 2026: 15 big-time throws and four turnover-worthy plays. Counts add; published grades do not.
What cuts the other way
Kyler leads adjusted completion, 76.4% to 75.4%, and clean-pocket passing grade, 78.3 to 75.0. JJ’s pressure-to-sack rate is higher. The strongest case can handle those facts.
04 / THE DECISION LEDGER
They moved on.
Then paid to change course.
Minnesota picks Murray.
Kyler is named the starter. JJ eventually sits third behind Murray and Wentz. Team announcement ↗
JJ out. A 2027 fifth in.
The Giants acquire McCarthy after Dart’s injury. Winston remains the starter initially; this was not an immediate JJ promotion. Trade details ↗
New York gets a look.
A productive relief appearance against New Orleans, then starts at Houston and Philadelphia. Two wins in the starts, with +0.090 EPA/dropback on 56 plays. Team wins are not a solo QB statistic. Game log ↗
A 2027 third out. Kirk back in.
Minnesota acquires Cousins from Las Vegas. This is a second transaction, not the return from trading JJ. Vikings announcement ↗
The job changes again.
Cousins is brought in to play. Murray is injured and expected to move into a backup role when healthy. Immediate availability remains a separate issue. Coach and GM explain ↗
Give Kirk his due. His Las Vegas season: 2,340 yards, 20 TDs, eight interceptions and a 97.1 passer rating. He is a credible attempt to improve the offense. The question is the decision path that made another investment necessary. Minnesota is still 6–2; this is a critique of quarterback production, not a claim the team stopped winning.
05 / THE HONEST PART
Keep the receipts.
Keep the small print readable.
Explosive ≠ consistent
JJ’s 2026 positive-EPA rate is 38.7%, versus Kyler’s 39.7%. JJ’s average value is better, but his successful plays are not more frequent.
Sacks still matter
JJ’s analytical sack rate is 12.0%, versus Kyler’s 8.2%. The Philadelphia game included five sacks and −0.012 EPA/dropback. It stays in the sample.
The red zone is tiny
Just four 2026 red-zone dropbacks for JJ: one completion, no TDs, −0.931 EPA/dropback. All seven TDs in his combined red-zone sample came in the older Vikings games.
When a pass was expected
With pre-snap pass probability above 70%, JJ produced +0.276 EPA/dropback on 49 plays, versus Kyler’s −0.207 on 107. Those 49 are a subset of JJ’s 80 total dropbacks including spikes. This is not a pressure split, and JJ does not meet a 50-play qualifying minimum here.
In competitive game states (20–80% pre-snap win probability), JJ is +0.149 on 51 plays and Kyler +0.007 on 159. These filters add context; they do not remove every difference in opponents, receivers or game situation.
No opponent adjustment. No claim that this predicts career success or the Vikings’ alternate season. Definitions, counts and sources ↗
06 / KEEP GOING
The latest
dispatches.
Giants game notes, the Cousins return, and what the new numbers actually say.
Read the ledger →One team.
Two QB buttons.
Land on the Giants. JJ ends it at 17–0. Dart gives you the Giants’ actual 4–13 record from 2025. Yes, we explain the rule.
Play the arcade →07 / THE MINNESOTA YEARS
The old case.
Preserved, not passed off as new.
The original forecasts and arguments remain in their dated snapshots. Today’s comparisons use measured results.
V10 · PRE-TRADE
The post-decision case ↗
The 78% model and Vikings-roster win projections. Historical forecasts, not current Giants results.
MINNESOTA NEWSThe dispatch archive ↗
The camp reports, commentary and sources exactly as preserved.
V9 · AUG. 11 MORNINGThe original case ↗
The archive banner records 86% any-point and 53% Week 1. The forecast stayed in that era.
THE RECEIPTS ARE PART OF THE PRODUCT
Public efficiency: nflverse. Charted passing: PFF, snapshot Nov. 11. Transactions and player information: Giants and Vikings. Read the full methodology →